Australia's most shared suburbs
Monday May 16 2016
The small inner city Sydney postcode of Chippendale – Darlington has been revealed as Australia’s most shared, according to recent analysis by Flatmates.com.au.
The data revealed that 22% or just over one in five private dwellings in the postcode (2008) were listed on the flat sharing website in the past year.
In equal second came the postcodes of Melbourne CBD (3000) and Brisbane CBD – Springhill (4000), with 19% of dwellings shared.
Melbourne’s postcodes West Melbourne (3003) and Southbank (3006) also made the list in eight and ninth place, respectively.
Unsurprisingly, Sydney’s steep rental prices pushed four additional postcodes Ultimo (2007), Pyrmont (2009), Bondi – Tamarama (2026) and the Sydney CBD (2000), into the top 10.
Chief executive officer of Flatmates.com.au, Thomas Clement, said his view of traditional share accommodation suburbs had been somewhat challenged by the results.
“When we think of share suburbs in say, Sydney, we think of Surry Hills, Darlinghurst, and Newtown, not Chippendale or Darlington,” said Clement.
“On reflection, however, it does make sense for a suburb like Chippendale to top the list given that it’s centrally located to the city and universities, well connected by public transport and has become increasingly cosmopolitan. It shares this commonality with many of the suburbs that ranked highly.”
26 postcodes across Australia had at least one in 10 dwellings that were shared while a further 70 postcodes had between five and 10% of dwellings.
However, Clement suggests the percentage of shared homes could be even higher.
“At the last census, for example, Brisbane – Springhill registered 899 group homes, our data alone shows this number has grown by 41%.”
“Given listings on our site account for around 62% of the share accommodation market the results might not include homes listed elsewhere or set up by friends, which means the numbers would be even higher.”
Flatmates.com.au achieved the results through analysis of share home listings created in the past 12-months and private dwelling data from the Bureau of Statistics.
| Rank | Post Code | Suburb | Percentage of dwellings shared |
| 1 | 2008 | Chippendale – Darlington | 22% |
| 2 | 3000 | Melbourne CBD | 19% |
| 2 | 4000 | Brisbane CBD – Springhill | 19% |
| 4 | 2007 | Ultimo | 18% |
| 5 | 2009 | Pyrmont | 17% |
| 5 | 4067 | St Lucia – St Lucia South | 17% |
| 7 | 2026 | Bondi – Tamarama | 14% |
| 7 | 3003 | West Melbourne | 14% |
| 9 | 3006 | Southbank | 13% |
| 10 | 2000 | Sydney CBD | 12% |
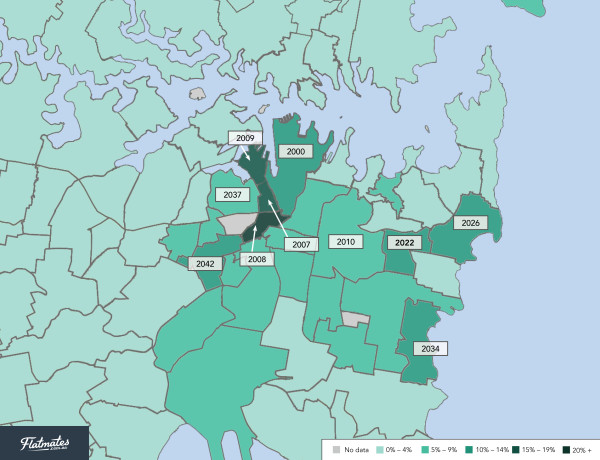
New South Wales Top Ten
 Map by J.McGrath
| Rank | Post Code | Suburb | Percentage of dwellings shared |
| 1 | 2008 | Chippendale – Darlington | 22% |
| 2 | 2007 | Ultimo | 18% |
| 3 | 2009 | Pyrmont | 17% |
| 4 | 2026 | Bondi – Tamarama | 14% |
| 5 | 2000 | Sydney CBD | 12% |
| 6 | 2042 | Newtown – Enmore | 10% |
| 7 | 2022 | Bondi Junction | 10% |
| 8 | 2034 | Coogee – South Coogee | 10% |
| 9 | 2010 | Surry Hills – Darlinghurst | 9% |
| 10 | 2037 | Glebe – Forrest Lodge | 9% |
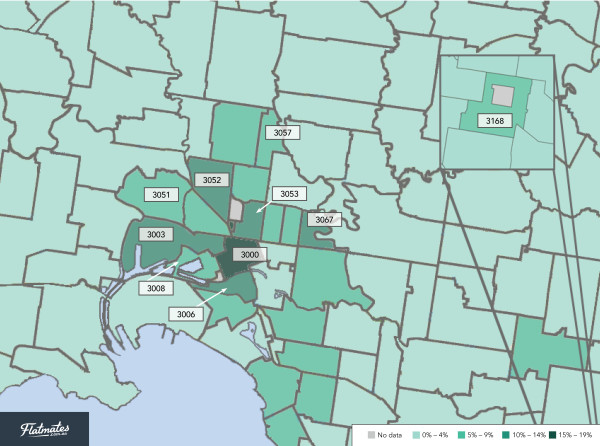
Victoria Top Ten
 Map by J.McGrath
| Rank | Post Code | Suburb | Percentage of dwellings shared |
| 1 | 3000 | Melbourne CBD | 19% |
| 2 | 3003 | West Melbourne | 14% |
| 3 | 3006 | Southbank | 13% |
| 4 | 3052 | Parkville | 12% |
| 5 | 3067 | Abbotsford | 12% |
| 6 | 3053 | Carlton – Carlton South | 10% |
| 7 | 3051 | North Melbourne | 9% |
| 8 | 3168 | Clayton | 8% |
| 9 | 3057 | Brunswick East | 8% |
| 10 | 3008 | Docklands | 8% |
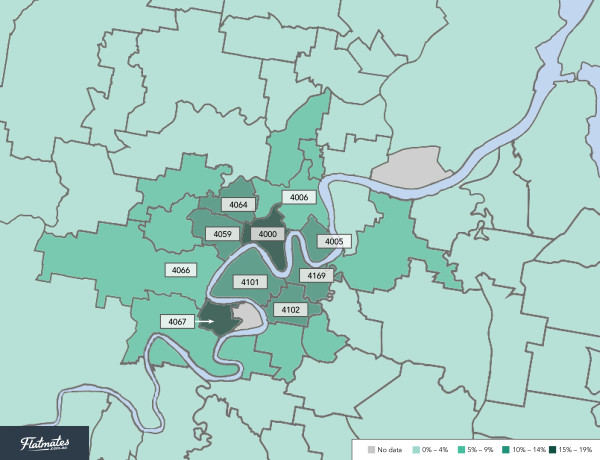
Queensland Top Ten
 Map by J.McGrath
| Rank | Post Code | Suburb | Percentage of dwellings shared |
| 1 | 4000 | Brisbane CBD - Spring Hill | 19% |
| 2 | 4067 | St Lucia – St Lucia South | 17% |
| 3 | 4169 | East Brisbane – Kangaroo Point | 12% |
| 4 | 4064 | Milton – Paddington | 12% |
| 5 | 4101 | South Brisbane – West End | 11% |
| 6 | 4059 | Kelvin Grove – Red Hill | 11% |
| 7 | 4102 | Dutton Park – Woolloongabba | 11% |
| 8 | 4005 | New Farm – Teneriffe | 11% |
| 9 | 4006 | Fortitude Valley – Newstead – Bowen Hills | 10% |
| 10 | 4066 | Toowong – Auchenflower | 9% |
- Full list of postcodes available by request.